
Google Analytics For Beginners – Visitors Overview
Updated June 2018!
Just getting started with Google Analytics? You’ve come to the right place!
Google Analytics, the free analytics tool from Google, can be confusing when you first dive in.
Fortunately, once you get familiar with the basic terms, it becomes easy to use and opens whole new worlds of insight regarding your web traffic.
On an exciting note (well, exciting if you’re into this sort of stuff), Google has made a fully fleshed-out Analytics Demo account available. We’ve updated this post to use screen shots from this demo account and you can get your own free Analytics account and/or add the Demo profile to your account to play with all this data yourself.
In this first post, we’re going to start at the start and have a look at the Standard Reporting Audience Overview (or “Visitors Overview” as it’s often called).
You can watch the video or read on below!
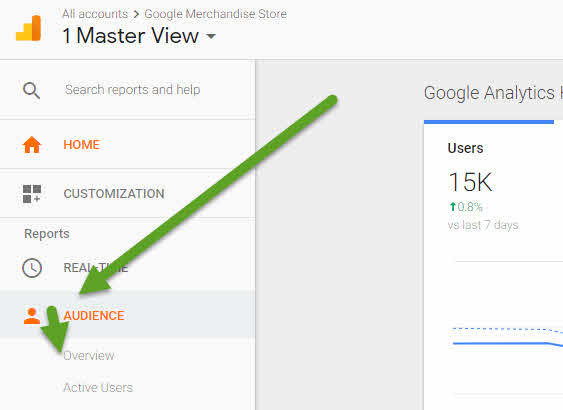
When you log into Analytics, you’ll see a Home screen. To get to the Audience overview, you click on “Audience,” followed by “Overview”:
Once you’ve done that, here’s what you’ll see:
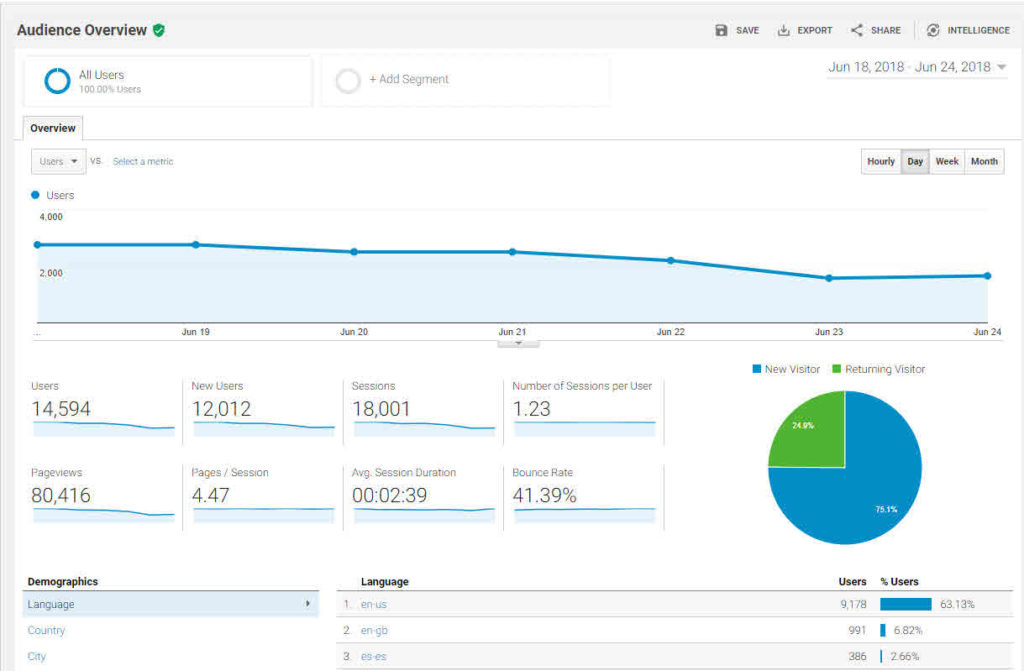
So… what are we looking at?
- The date range is shown in the top right and can be changed to any range you like by clicking on the drop-down arrow.
- The line graph you see represents the number of visits (users) by day and can be changed to include other metrics (although we’ll leave that for another post).
- The Pie Chart at the bottom right shows the proportion of New Visitors (people who Google has not tracked as having previously visited your site) versus Returning Visitors, who as the name suggests, are visitors that Google has tracked as having visited your site previously.
Note that your Returning Visitor stats are likely under-reported in practical terms as many visitors who come to your site from multiple different computers or browsers will be shown as New Visitors.
The dashboard stats shown are as follows:
- Users – the number of different people who came to the site
- New Users – the number of people visiting for the first time
- Sessions 0 the actual number of visits to the site (some folks visit more than once, so Sessions is always higher than Users or New Users)
- Number of sessions per user – the average number of visits to your site each person made
- Page Views – as it sounds: the number of pages that were viewed on your site
- Pages / Session – the average number of pages that were viewed on each visit
- Avg Session Duration – the average time spent per visit on your site (noting that Analytics doesn’t count the time for the last page your visitor was on, which means that this can be under-reporting, particularly if you have pages like blog posts that people land on, read, then leave. In this example, the visit would count as zero seconds!)
- Bounce Rate refers to the percentage of visitors who landed on a single page on your site and left the site without navigating to a second page. In general, bounces are considered “bad” although in some cases (i.e. if someone is looking for your phone number and finds it on the first page), it isn’t necessarily a negative thing.
Upon reviewing these stats a lot of folks wonder what their stats “should” be. My typical answer is “there is no right number as every business is different.” What I usually recommend is that folks look at which stats they can work on improving and try to bump up the numbers in those areas. For instance, if you improve your site to make it more “sticky,” you’ll hope to see a corresponding increase in the Pages/Visit.
Want to look a bit deeper?
Geo, Technology and Mobile are 3 other Audience reports that will quickly give you insights as to your visitors:
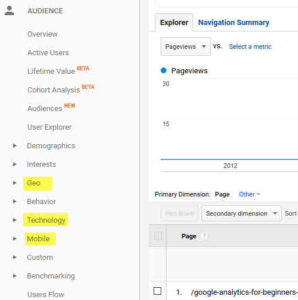
- Geo lets you quickly see where your visitors came from by Country or City
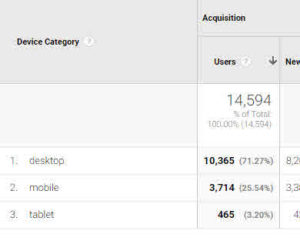
- Mobile gives you a quick overview of what your breakdown was between desktop, mobile & tablet traffic:
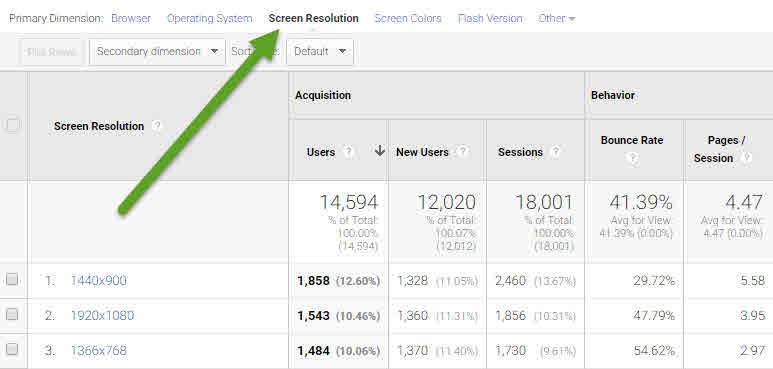
You can also look at Mobile – Devices and see exactly which sort of phones and tablets your users visited on. - Technology – Browser and OS let’s you see the browser and OS of your visitors. More interesting (to me at least) if you click on “Screen Resolution” you can see the screen size of your visitors, which is a critical consideration when it comes to designing your site and pages:
In our next post we’ll have a look at the Acquisition Overview page (which is possibly the most important section of all!).
To be notified when the next post comes out, simply sign up for our monthly newsletter in the sign up form to the right…

![Social Media ROI – Growing and Showing Your Results [Social Media Camp 2015]](https://plusroi.com/wp-content/uploads/2012/07/bloglike-1024x536.jpg)