Assess Your Website with GTmetrix
As professional marketers, there are about a dozen tools that we regularly use to assess website performance for clients.
One of the easiest tools to use that can give you great, immediate insights is GTmetrix.
The Interface
To use GTmetrix, simply go to the GTmetrix website and put your url in the “Enter URL to Analyze” field and hit “Analyze”

To have a look at the specifics of what’s in GTmetrix, let’s look at JumpStartWeb, a recent site that we’ve optimized for speed.
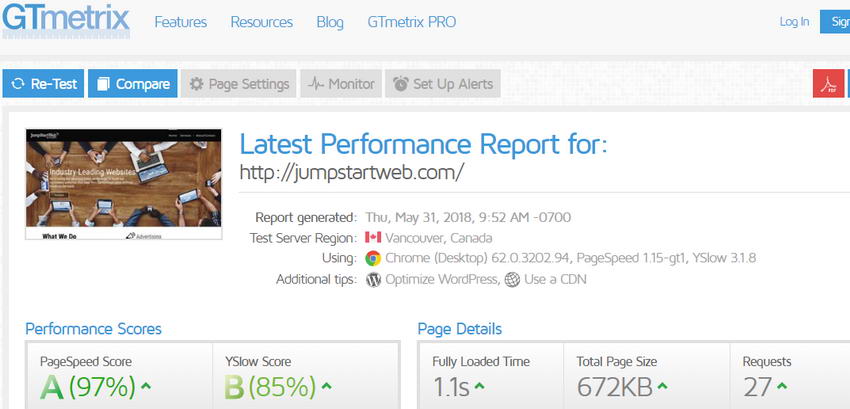
Upon analyzing JumpStartWeb.com, this is what we currently see:
In short, the more of your Performance and Page Details in green, the better!
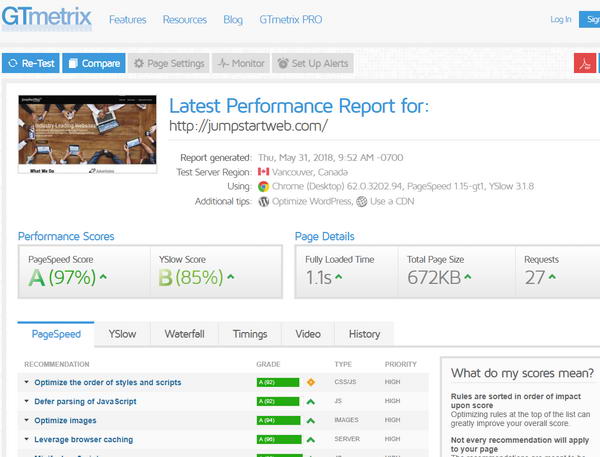
Let’s look at the individual rankings:

PageSpeed
- Based on Google’s PageSpeed Insights Tool. This doesn’t measure actual speed but, rather, how Google feels you adhere to best practices for speed!
- This is important, as Google may use this and it might affect your performance in both Google Search and Google Adwords.
- Within the PageSpeed tool itself, it’s broken out between desktop and mobile scores.
- Google is very stringent with this test and it’s hard to do well. The average score is 71 and, in general you want to see a score of at least 75 (over 70 on mobile and over 80 on desktop).
- You’ll see any issues showing up in the details lower on the page, but you’ll want to use the PageSpeed tool itself to discover whether these are mobile or desktop issues (or both).
- In short, if you have an 80+ ranking you don’t need to worry about this at all. If your score is below 80 you’ll want to check your ratings in the Google PageSpeed Tool itself and it will tell you some ways to improve performance.
YSlow
- This is the Yahoo (remember them?) test which is quite similar to PageSpeed.
- Their average score is 70
- You get an “F” (0) rating for their “CDN” factor unless you are using a Content Delivery Network (which may well actually not be necessary for you!)

Fully Loaded Time
- This is just what it sounds like – how long it takes for your site to actually load.
- The average time is 6.7 seconds but in a perfect world you’d want to aim for less than 2 seconds to avoid page abandonment from mobile visitors (Google says that “53% of visits are abandoned if a mobile site takes longer than 3 seconds to load”).
Total Page Size
- Again, just what it sounds like! This is the size of your page (as measured in kb or mb).
- The average size is 2.97 mb, but you’ll want to aim for under 2 mb if possible.
- From a user perspective, this could very well be your most important metric.
- This is one area where a fast host can make a huge difference (as well as site optimization).
Requests
- This is the number of calls made from the browser to the server to load your website.
- The average is 88, although minimizing requests is not critical in itself unless they are affecting load times (focus first on your load time before worrying about number of requests.
Should you panic if your results are bad?
Possibly not. These scores range widely across different industries. You don’t necessarily need to beat the average, you just need to beat your important competitors (you can find them in Google and test them using these same tools). Much like coming across a bear in the woods, you don’t need to outrun the bear, you just need to outrun whoever else you’re with!
Shameless Plug Alert:
At PlusROI we work on WordPress site optimization for clients literally every day. If you have a quick question, we’re happy to offer advice or would love to have a look at your site and brainstorm some quick and cost-effective ways we could help you. Please contact us!


![Social Media ROI – Growing and Showing Your Results [Social Media Camp 2015]](https://plusroi.com/wp-content/uploads/2012/07/bloglike-1024x536.jpg)